Optimization Workflow
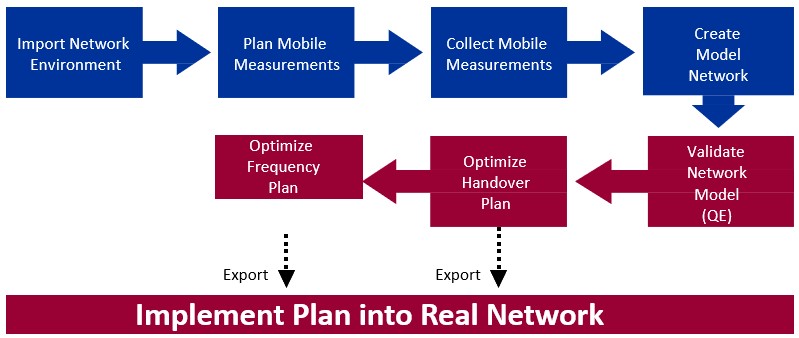
The optimization workflow shown in the figure below will be implemented in the proposed Project:
Import
The input data comes from the following sources:
- Network configuration, based on the OSS network configuration file (Vendor specific)
- Site locations (coordinates) text file
- Mobile Measurement report statistics collected from the network (vendor specific)
- Traffic and blockage statistics collected from the network
We will use our standard interface to automatically load and process the data.
Network audit
GSM Basic Feature audit
- Power control
- DTX
- Frequency Hopping
- TCH Allocation priority
- AMR HR activation
- Intracell Handover
Design analysis
The following activities will be performed:
- Swapped sector analysis
- Wrong azimuth detection
- Overshooting sector analysis
Spectrum analysis
The following activities will be performed:
- Spectrum Analysis: Frequency band used per area, BCCH vs TCH split, hopping type.
- BSIC and BCCH reuse plan
- NL audit
Network clean up implementation
The following activities will be performed:
- NL clean up to allow for proper MS collection (BAL full)
- BCCH/BSIC clean up
- Basic feature activation (PC, DTX, Hopping0
Network Modeling
The network modeling process is based on Mobile Measurement Report statistics collected from all sectors in both optimization and affecting areas.
Since mobile measurements are based on actual network traffic, and measurements are collected from all mobile phones being used, the model provides an accurate reflection of the indoor/outdoor traffic split and the pedestrian/vehicular mobile split. Creating a network model based on mobile measurement data is more accurate than creating a network based on conventional RF modeling using geographical data, since geographyVbased models do not take the distribution of network traffic into account.
Network Analysis
Mobile Stations constantly communicate with the BTS and relay pertinent information such as:
- Downlink Full/Sub Rx quality
- Downlink Full/Sub Rx level
- Downlink Rx level for up to 6 measured BCCH frequencies with decoded BSICs
- Uplink DTX usage flag
The BTS completes a measurement report with the following additional data:
- Mobile Station power step
- BTS power attenuation
- Uplink Full/Sub Rx quality
- Uplink Full/Sub Rx level
- Downlink DTX usage flag
- Timing advance
The measurement report is sent over an Abis interface (BTSVBSC) once every 480 msecs. The mobile station reports the Rxlevel for up to six BCCH frequencies, with decoded BSICs and the serving cell Rxlevel. The six strongest BCCH frequencies with decoded BSICs and an allowed NCC are reported. OnVtheVair interface reports are mapped into a signaling logical channel (SACCH), which is associated with each TCH. The mobile station performs measurements during the period between the transmission of an uplink burst and the reception of a downlink burst.
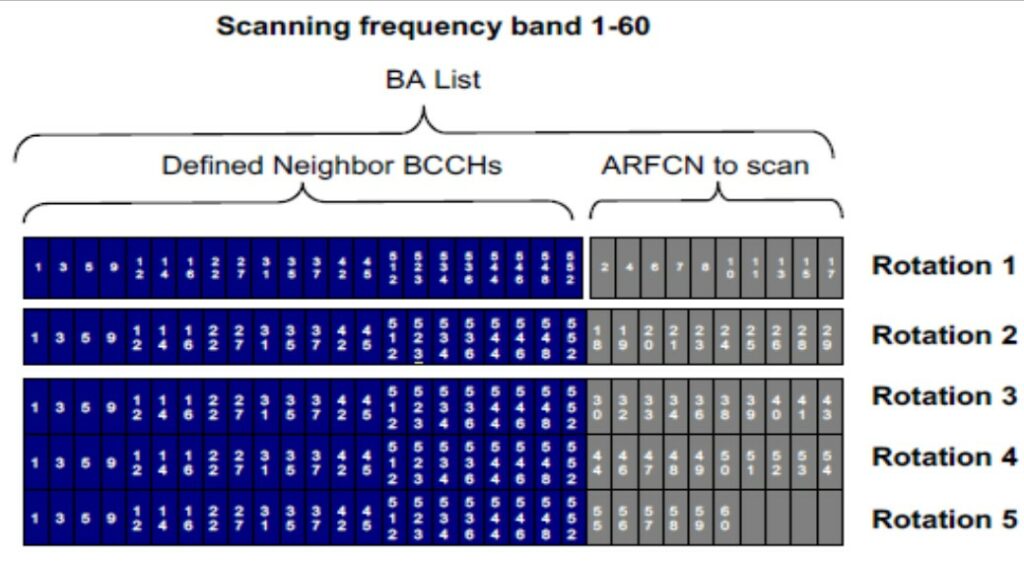
The BSC provides the mobile station, via the BTS, with a list of frequencies (called the BCCH Allocation List, or BAL) to be measured. The BAL usually contains the BCCH frequencies of all cells, defined as neighbors to the cell serving as the Mobile Station. The maximum number of frequencies in the BAL is 32.
In order to use mobile measurement reports for modeling, the interference level from each pair of sectors in the network should be measured. These measurements are estimated from a comparison of the RxLevel of the serving sector to the RxLevel received from one of the sectors in each measurement report.
In order to provide a comprehensive interference picture, mobiles should be able to report on all possible interferers. Since the regular GSM procedure provides for measurements of the BCCH frequencies of defined neighbors only, frequency scanning should be implemented.
For the purpose of optimization, We will use a proprietary frequency planning and optimization solution to generate the network impact (interference) matrix.
An impact is a measure of the expected interference percentage between a pair of sectors. In other words, it is the probability (in terms of %) of having interference in the case of coVchannel or adjacent channel reVuse between two sectors.
The value of an impact does not depend on whether there are reVuses between the sectors involved. The impact matrix shows all the impacts in the network for both coVchannels and adjacent channels. The rows of the impact matrix are the "from" sectors (the sectors from which impacts originate), and the columns are the "to" sectors (the sectors that receive the impacts).
QoS analysis
The following activities will be performed:
- Spectrum Analysis: Frequency band used per area, BCCH vs TCH split, hopping type.
- Benchmarking baseline vs. proposed configurations
- Spectral Efficiency Analysis
- Effective Frequency Load (EFL) vs. Quality (FER/RxQual)
- Half Rate (GSMVHR/AMRVHR) utilization
- MOS prediction
- Accessibility (BCCH layer evaluation)
Equency Optimization
The QoS performance simulator uses the network model to generate the frequency plan that can best lower network interference levels and improve overall network quality for carvingVout spectrum for UMTS or LTE by minimizing the carveV out interference impact on GSM network and maintaining the network performance/
The QoS performance simulator uses the network model to generate the frequency plan that can best lower network interference levels and improve overall network quality for carvingVout spectrum for UMTS or LTE by minimizing the carveV out interference impact on GSM network and maintaining the network performance/
Implementation
Results of the frequency plan optimization can be generated in excel format for the convenience of the engineers. The implementation is typically performed overnight.
Results of the frequency plan optimization can be generated in excel format for the convenience of the engineers. The implementation is typically performed overnight.